Fall 2021 Dashboard and Survey Updates
by Nina Kumar
Posted on September 17, 2021
Since the start of the COVID pandemic Authentic Connections has collaborated with over 150 schools. We have been lucky to learn from each of our partners, whose feedback has informed our work and shaped the development of our surveys, dashboards, and support services.
Our latest round of updates, available to schools surveying in the 2021-2022 school year, are focused on providing a simplified view of demographic groups to identify those that may need additional attention, streamlining dashboard operations to make it easier than ever to dive into findings, and updating survey measures based on the latest research.
Read on for an in-depth look at these exciting changes or click below to start collaborating with AC now!
Get Started →
What's New?
Dashboards
We have updated our interactive results dashboards to make it easier than ever to identify groups that need additional attention, compare free response data across demographic groups, and quickly explore survey findings.
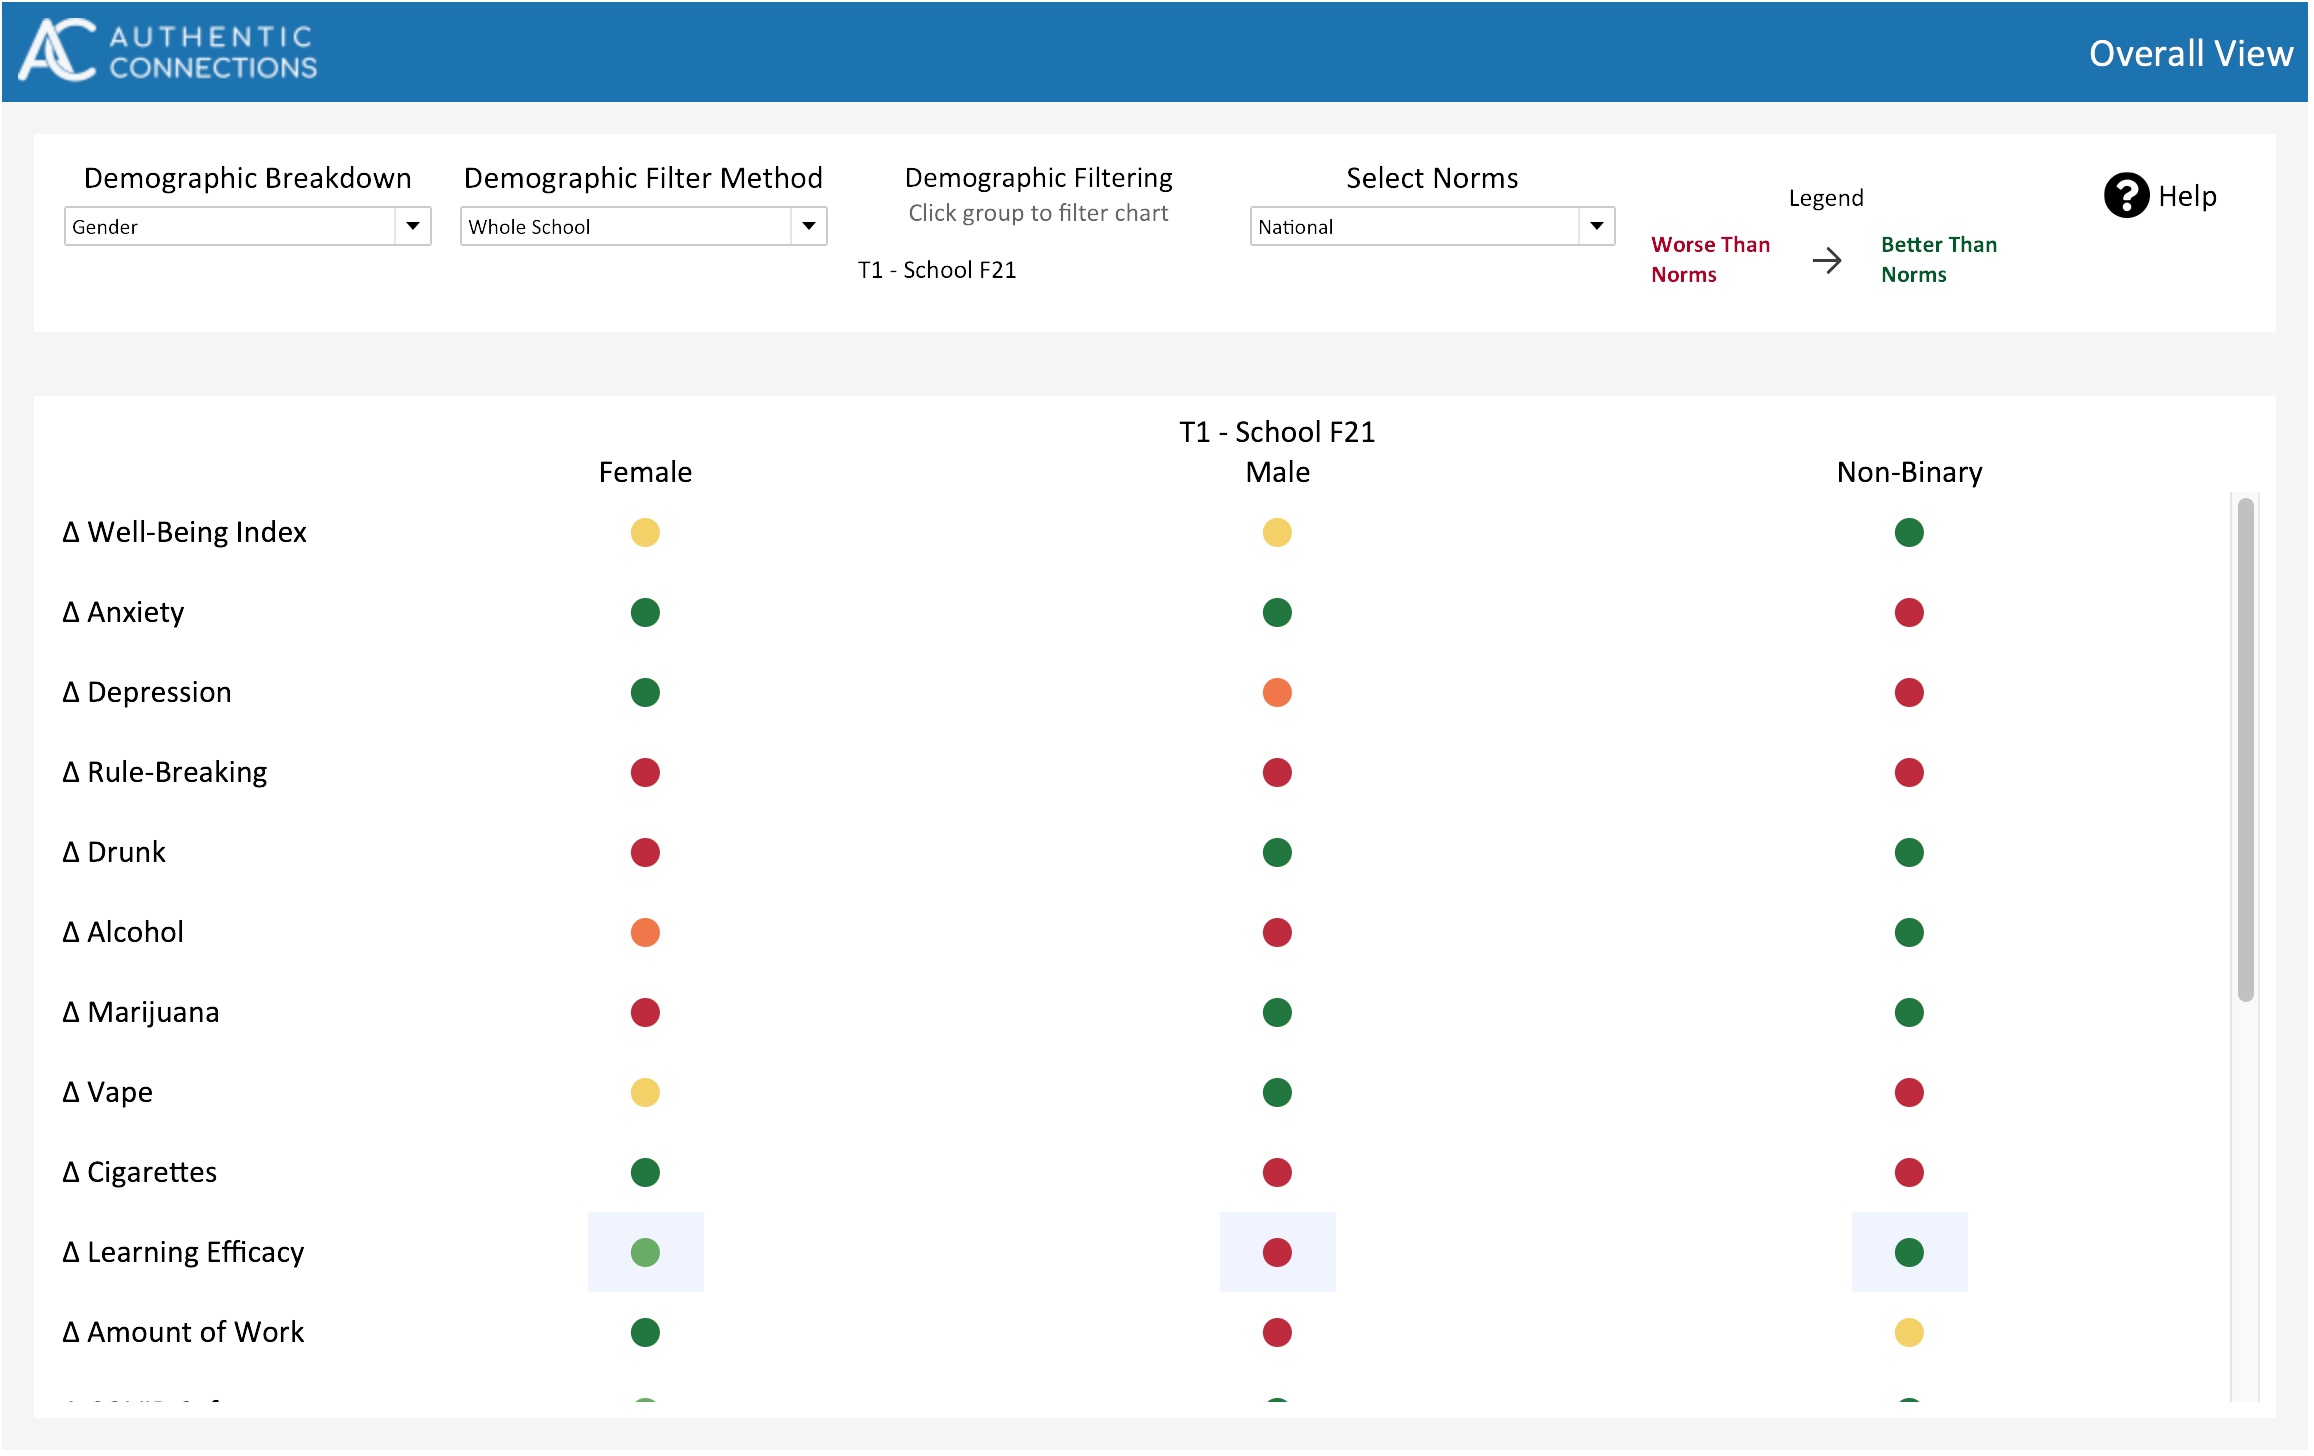
- Overall View Dashboard: Quickly Understand variations by Demographic Groups
- It is important for school leaders to not only understand how their community is faring overall, but also to identify groups of students, faculty, and staff that may need additional attention. Our survey results dashboards allow users to see all results broken down by demographic groups, such as by gender, race/ethnicity, grade level, role at school, and more. In this update, we’ve added a new executive summary overview that enables users to see how demographic groups fare, relative to norms, across all measures on one page. This new view will save users significant time by highlighting trends, and groups that may require additional intervention on one comprehensive page.
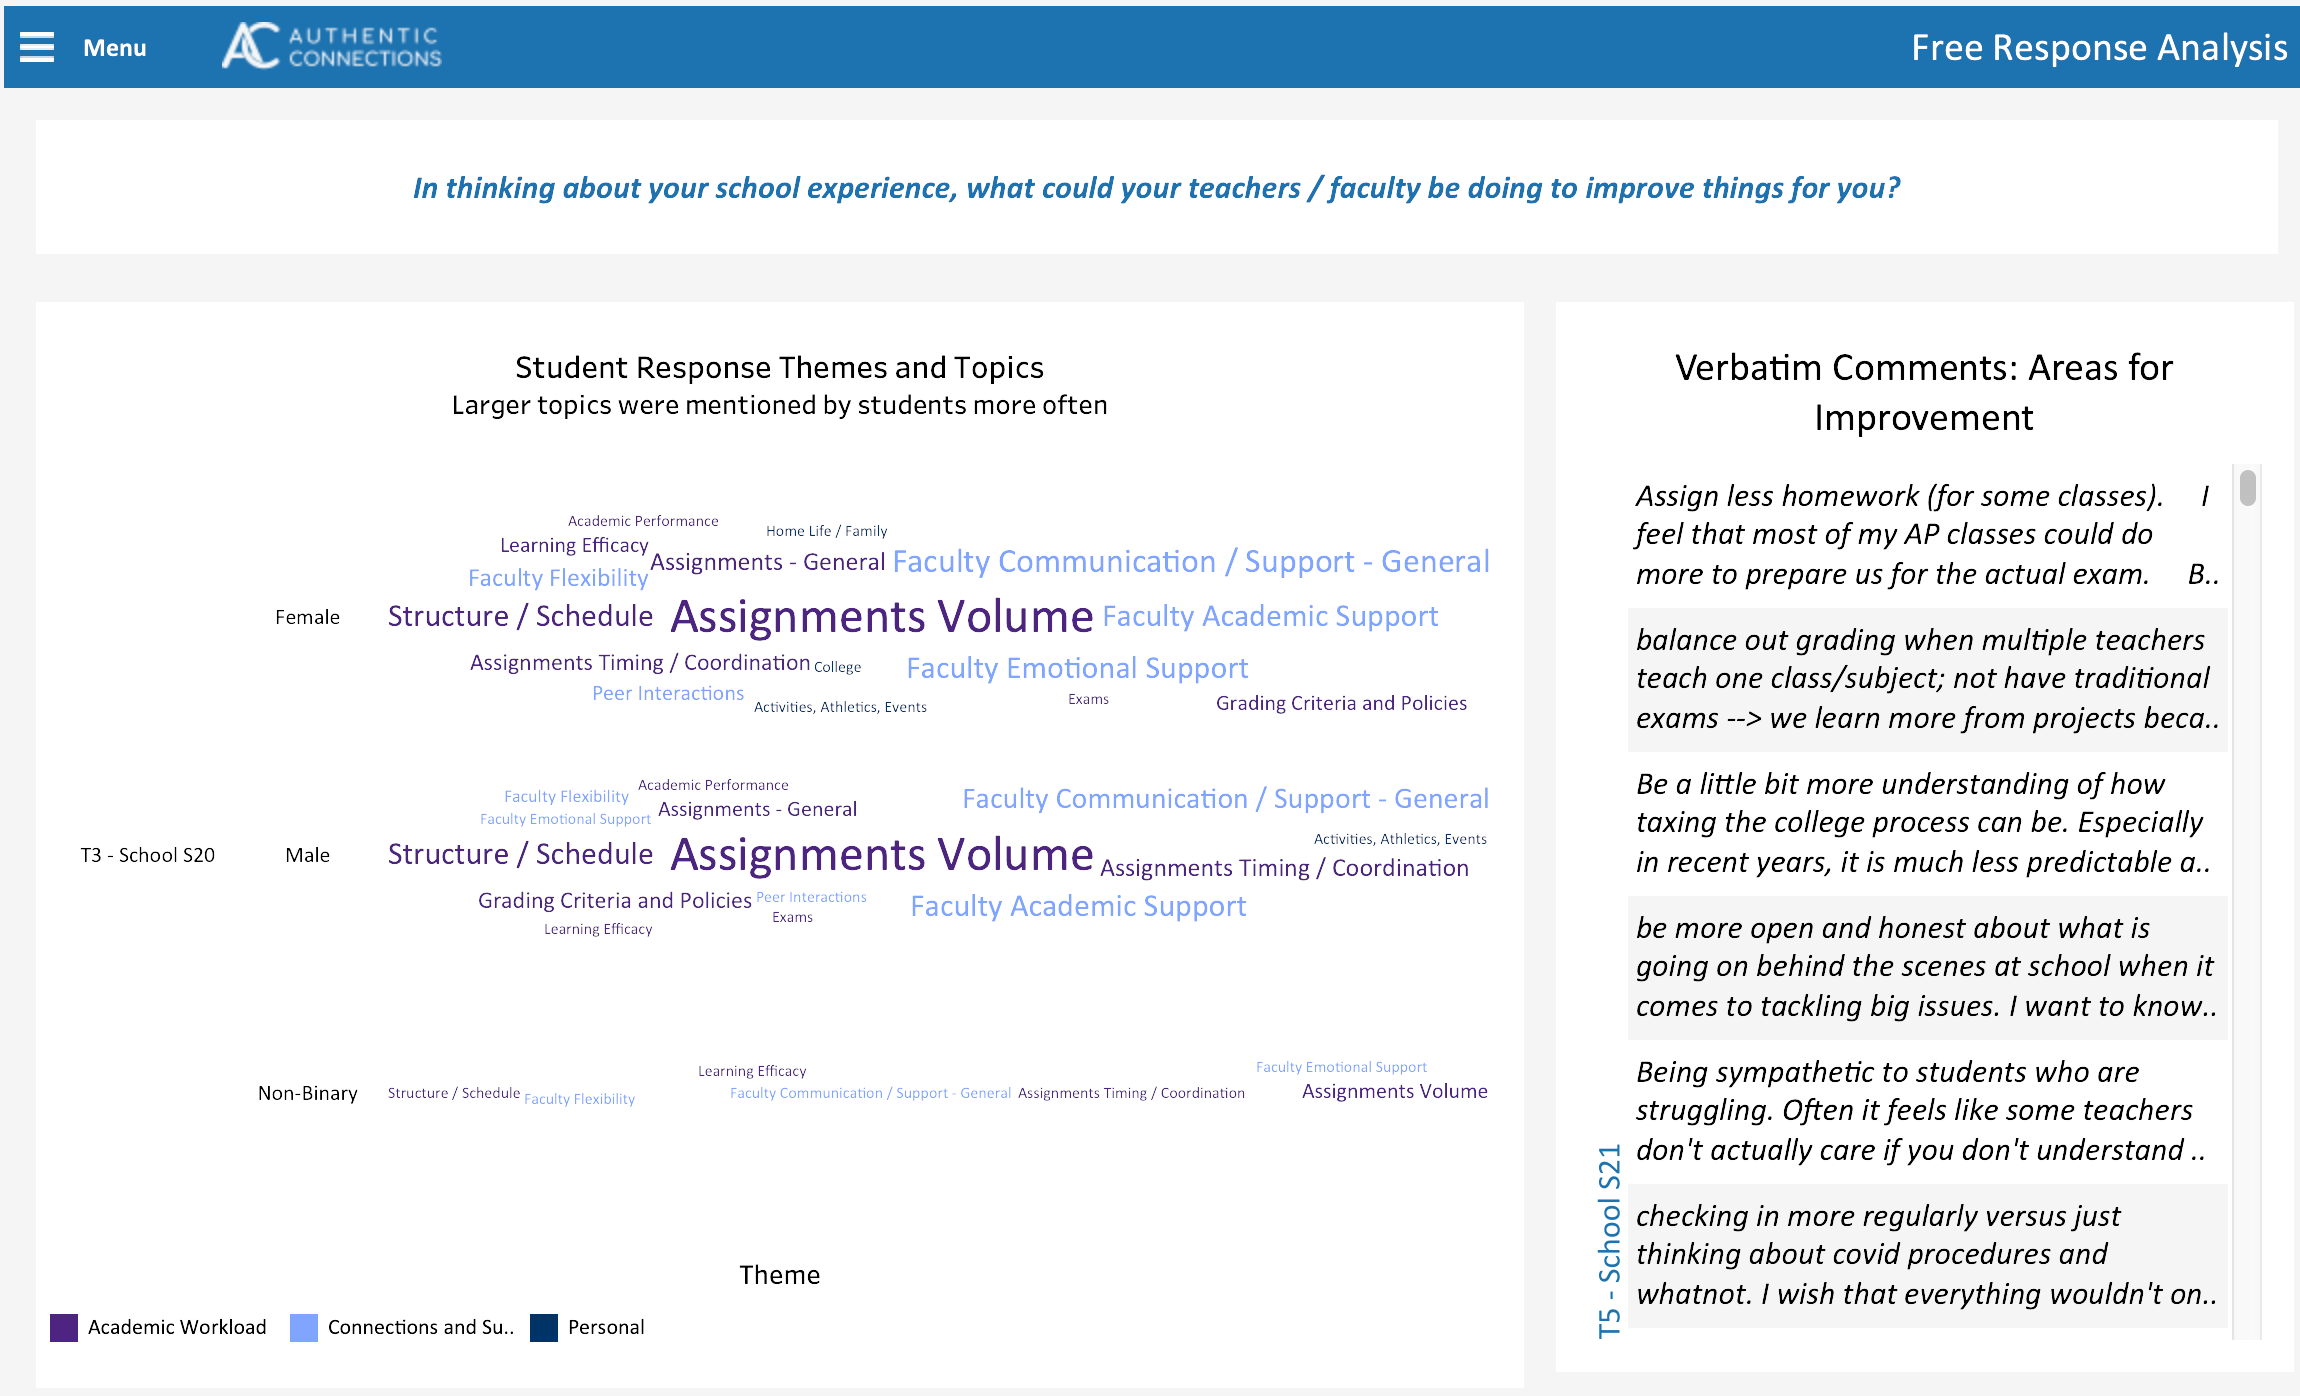
- Free Response Dashboards: Compare Responses by Demographic Groups
- Many of our partners have expressed appreciation for the free response word-cloud and Marimekko charts, which show the most common response themes and topics for each free response question. As with the qualitative data, these charts can be filtered by demographic variables. With our latest release, we’ve added the ability to compare these charts across demographic groups, making it easier than ever to understand how responses vary across groups. For example, users can now see a word-cloud for responses from students in each grade level, highlighting key differences in students’ experiences by grade.
- Dashboard Responsiveness
- We understand that your time is valuable, and we’ve made changes to the way results dashboards function to significantly improve performance. All dashboards will now load and react significantly faster! For users who wish to take a deep dive into survey findings, doing so has never been easier.
- High Achieving Schools Survey: Breakdown for Confiding in Adults
- With the COVID-19 pandemic continuing across the country, it’s more important than ever for schools to understand which adults students feel most comfortable confiding in. To help schools facilitate this, users will now be able to break down our “Confiding in Adults” data by demographic variables; for example, schools will now be able to understand what percentage of 9th graders feel comfortable confiding in an advisor at school.
- Parent/Guardian Resilience Survey: Comparison Norms
- Our sample of schools participating in the Parent/Guardian Resilience Survey (PRS) has grown to the point where we can now provide comparison sample norms on the PRS dashboards. Starting in fall 2021, schools that participate in the PRS will be able understand how they fare, relative to other schools, in key areas.
- Updated Averages and Comparison Samples
- At the end of each semester, we update the normative sample, which now consists of data from over 40,000 students and 7,000 school faculty/staff assessed since the start of the COVID pandemic in March 2020. This large and scientifically-valid database incorporates overall shifts in well-being that have occurred since the pandemic began, and will continue to grow as we survey additional schools in the 2021-2022 school year. These updated data will also benefit users who choose to compare to regional samples of similar schools in the immediate area, similar schools based on type (e.g., Independent schools, Boarding schools, Public schools), and by population served (e.g., all genders vs single-gender).
Surveys
We continuously refine our survey measures based on the latest research findings and topics top of mind for schools. This summer we have made the following changes:
- Faculty Resilience Survey: Drilling into Sources of Support
- Open-ended responses on our faculty/staff survey have highlighted how the COVID pandemic has impacted faculty/staff responsibilities and relationships with colleagues and administrators. To help schools understand the effects of these shifts, we have added additional measures around feelings of administrator and collegial support, and measures to assess the effectiveness of professional development, mentoring opportunities, and more.
- Parents Resilience Survey
- The newest iteration of the Parent / Guardian Resilience Survey (PRS) is designed to help administrators understand parents’ satisfaction with various aspects of school life. This year we have added new measures to assess communication from administrators and teachers, teacher emotional and academic support, satisfaction with school programing (e.g., mental health, DEI, academics), and feelings of belonging.
- High Achieving Schools Survey / Student Resilience Survey
- Our student surveys have been updated to gather information most needed by administrators as they navigate another pandemic school year. Students will now be asked about school emphasis on mental health and opportunities to connect with peers at school. Understanding student perceptions around mental health and connections with peers will help administrators make modifications during the year that will have the greatest benefits for students.
All of the updates that we make to our surveys and dashboards reflect the invaluable feedback that we’ve received from our partner schools. Thank you to our colleagues for your dedication to supporting your community’s health and happiness. If you have any thoughts or ideas on what you’d like to see us do next,
please email us.
Our surveys and dashboards are continuously improving. Read about our Spring 2021 Updates here:
Spring 2021 Updates →