Logo

High Achieving Schools Survey - Winter 2020 Update

by Nina L. Kumar


Posted on January 20, 2019


HASS Winter Update

Today we are releasing the Winter 2020 update for our High Achieving Schools Survey (HASS) and Dashboards! This overview will provide a high-level understanding of the changes we’ve made in this release and how it will benefit our schools.

What's New?

Dashboards

In our Winter 2020 update we’ve made one big dashboard change:

  • Updated HAS Averages, based on ~ 15,000 HAS students assessed in 2019
    • With this large, recently assessed sample, updated norms provide an excellent way for schools to gauge their students’ well-being relative to other similar schools.

Surveys

  • Facilitating Inclusivity
    • As part of our ongoing efforts to maximize inclusivity, the survey now anticipates that many students have same-sex parents, or alternative guardians such as extended family members. Going forward, instead of asking students about specifically their “mother” and “father”, we will ask about “parents/ guardians”. (Until this release, we’ve asked about “mother” and “father” separately because this was the wording in several original peer-reviewed, published measures).
    • The new, modified questions have already been tested for good reliability and validity.
  • Reasons for Cheating
    • We've added a new set of questions to give administrators insight into students' motivations for cheating.
reasons for cheating dashboard
  • Hyper-Parenting
    • A lot of recent media coverage has been dedicated to hyper-parenting or helicopter parenting. To ensure that we're providing our schools with the most up-to-date research on the topic, we've updated some of our questions around parent-child relationships.

Miss our last update?

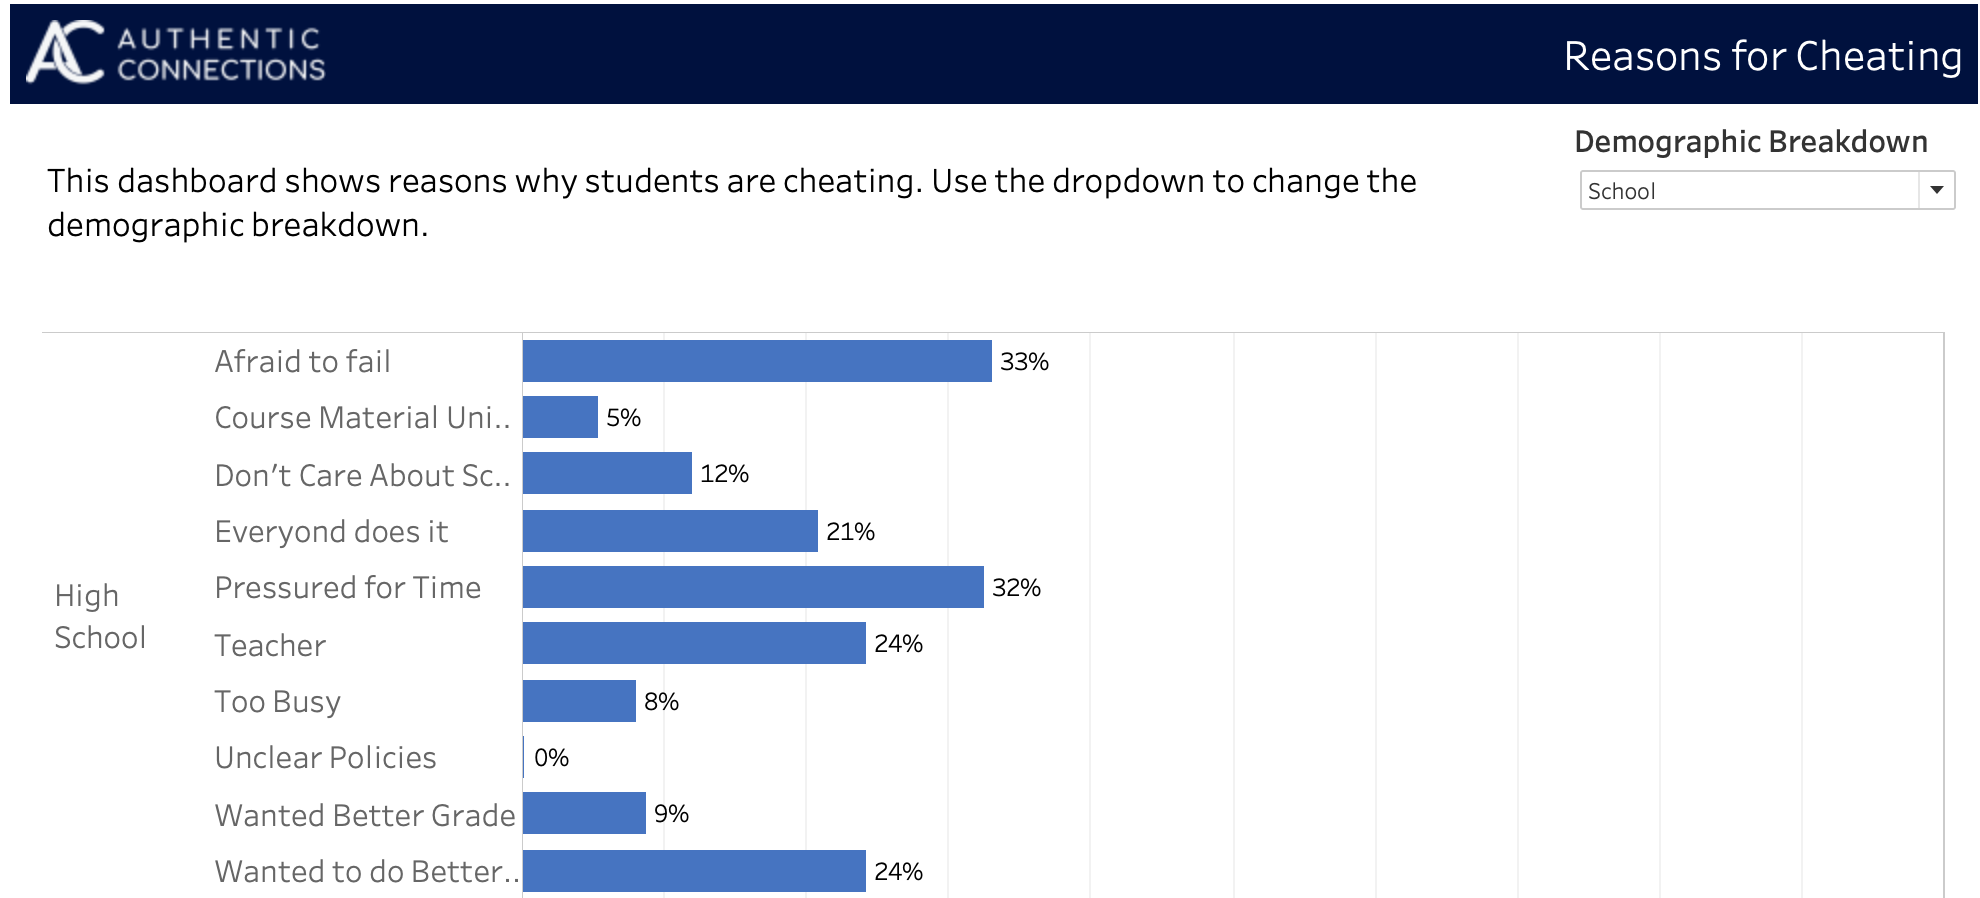
By the way, did you miss our Spring 2019 release? We released our new interactive dashboards that allow administrators to further explore their data.

Some highlights of the release were:

  • Demographic Variable Selection: enabling users to view survey information by demographic variables (e.g., by gender, grade, race, etc.)
  • HAS Norms: adding benchmark reference lines for our sample on measures
  • Top 3 X Top 3 Chart: delivering an in depth view of the top 3 factors affecting student well-being at the surveyed school by associations with symptoms and relation to norms
  • Dashboard Accompanying Document: providing schools with guidance on dashboard navigation and data interpretation

We would like to extend a sincere thank you to the partnering schools who helped us identify these areas for change and improvement. Your help truly enables us to better serve our communities!

Contact Us to Learn More →
Categories

Coming Soon!